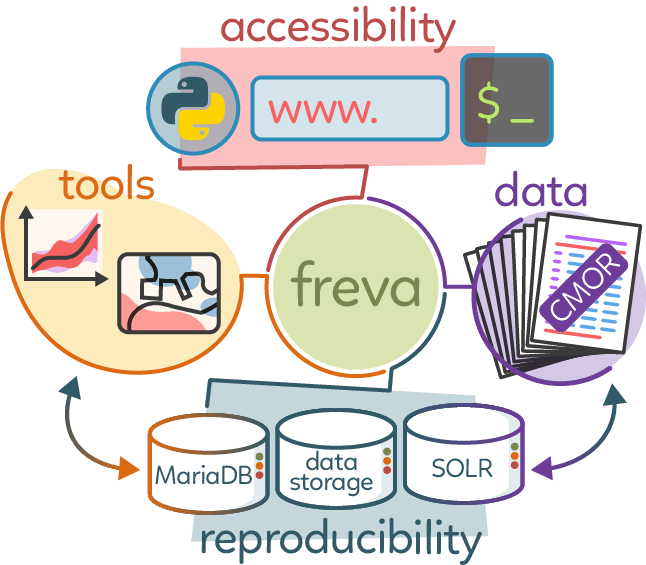
Freva
Connecting
Climate Data, Tools and Poeple
Martin Bergemann, DKRZ

1.
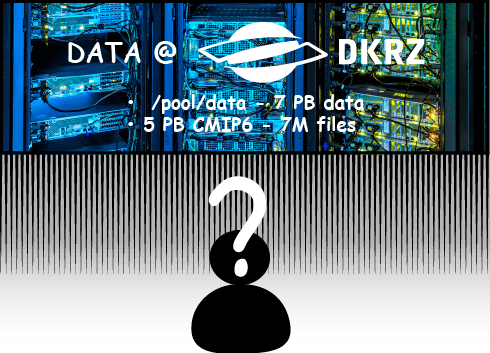
Finding and accessing Data
2.
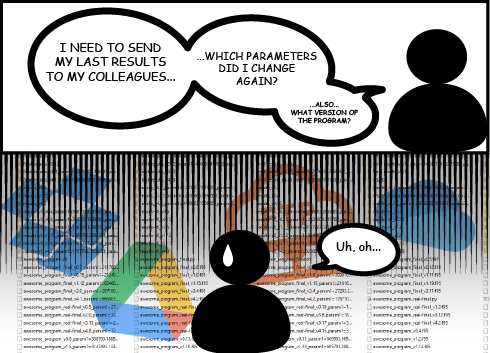
Make "effortlessly" use of Code of others.
Achieve Reproducibility
3.
3. Common Problems
Yet Another Solution:
Why Freva?
🐣
2012
Made for
Modellers
Modellers
🔒
Secure
Enterprise
Grade
Grade
🤝
Integration
Works with
Other Tools
Other Tools
👑
2025
Most Complete
Metadata Store
Metadata Store
Distributed Architecture:
Simple Client
Simple to Use
REQUEST

Server
Handles Complexity
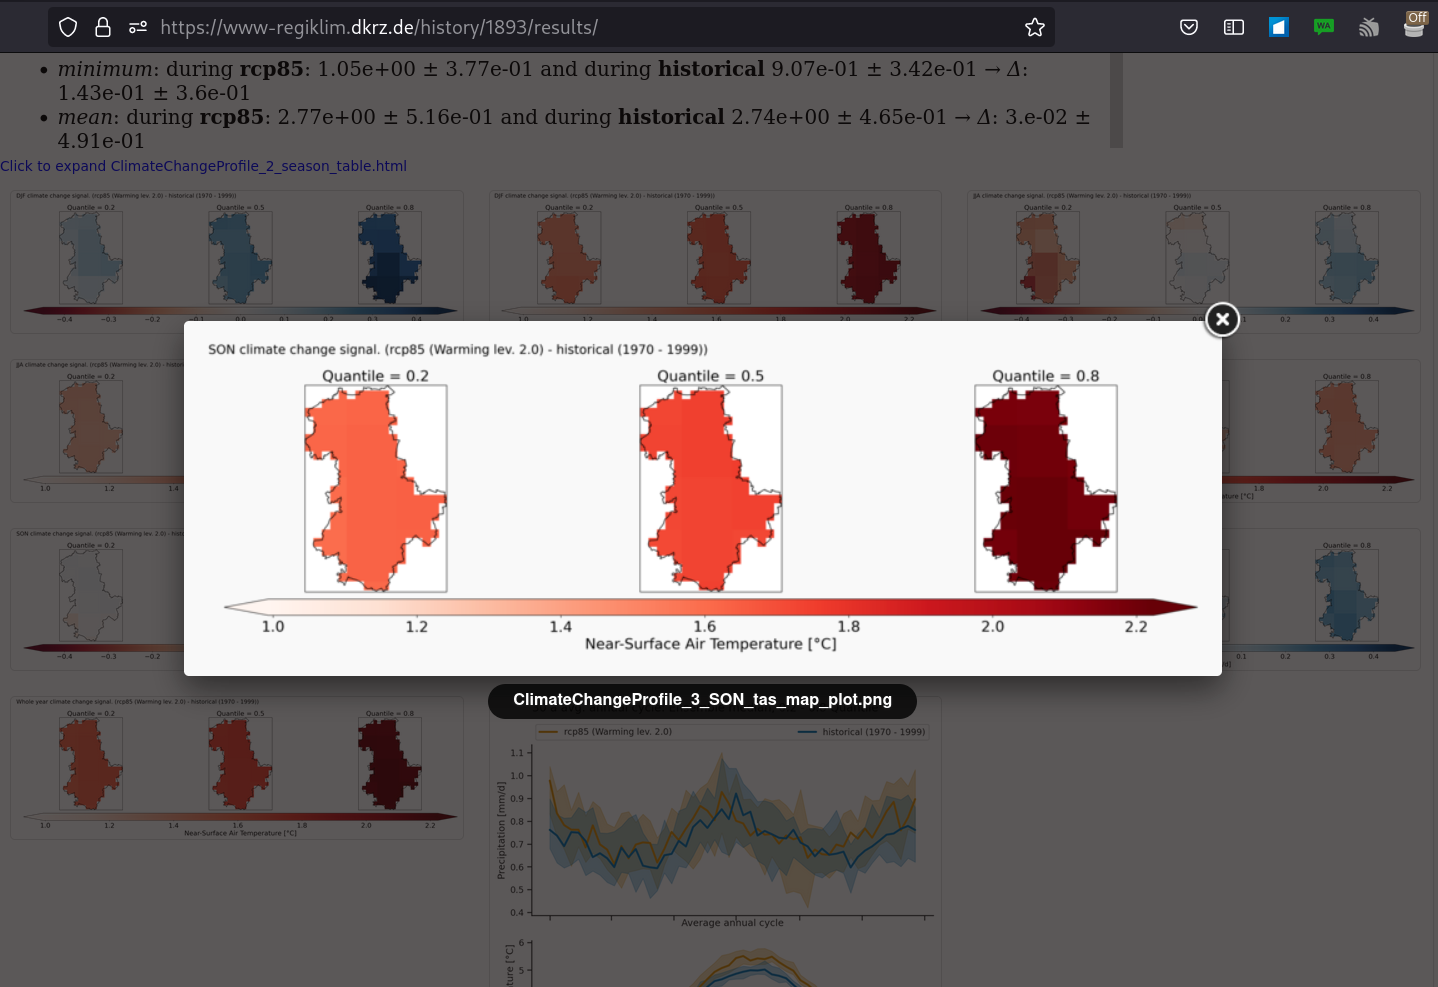
Three different UI flavours:


Rapidly Search many Datasets
Additional Features:
- Four different pre-defined search facet flavors
- Users can define their search own facets
- Users can add their own datasets
- Dynamic STAC Catalog generation
- Download static STAC Catalogs
- Generation of intake-esm catalogs
- Inspect metadata on the web app
Access Data from Anywhere as Zarr
- Convert data on HPC storage to zarr over HTTP.
- Secure via OAuth2 tokens.
- Access from anywhere.
from freva_client import authenticate, databrowser
import xarray as xr
token = authenticate(host="https://www.gems.dkrz.de")
data = databrowser(
   host="https://www.gems.dkrz.de",
   flavour="cmip6",
   mip_era="mpi-ge",
   variable_id="tas",
   experiment_id="historical",
   stream_zarr=True
)
print(list(data)[0])
https://www.nextgems.dkrz.de/api/freva-nextgen/data-portal/zarr/5b8ec334-d2c9-536d-9b8e-249bbd34ac23.zarr
ds = xr.open_mfdataset(
data,
engine="zarr",
decode_times=xr.coders.CFDatetimeCoder(use_cftime=True),
storage_options={
"headers":{"Authorization": f"Bearer {token['access_token']}"}
})
print(ds)
xarray.Dataset> Size: 138MB
Dimensions: (time: 1872, lat: 96, lon: 192)
Coordinates:
* time (time) object 15kB 1850-01-31 23:52:00 ... 2005-12-31 23:52:00
* lon (lon) float64 2kB 0.0 1.875 3.75 5.625 ... 352.5 354.4 356.2 358.1
* lat (lat) float64 768B -88.57 -86.72 -84.86 -83.0 ... 84.86 86.72 88.57
Data variables:
tas (time, lat, lon) float32 138MB ...
Attributes:
CDI: Climate Data Interface version 1.9.5 (http://mpimet.mpg.de/...
Conventions: CF-1.6
history: Thu Dec 13 08:45:54 2018: cdo -f nc -r setpartabn,tas.parta...
institution: Max-Planck-Institute for Meteorology
CDO: Climate Data Operators version 1.9.5 (http://mpimet.mpg.de/...Users can easily create/apply simple UI's for their tools
A small python wrapper makes it possible
from evaluation_system.api import plugin
from evaluation_system.api.parameters import File, ParameterDictionary, SolrField
class PlottingTool(plugin.PluginAbstract):
   """Plugin that plots content of selected data."""
   tool_developer = {"name": "Jane Doe", "email": "Jane.Doe@example.com"}
       __category__ = "support"
       __short_description__ = "Plot data"
       __version__ = (2022, 1, 1)
       __parameters__ = ParameterDictionary(
           File(
               name="in_file",
               file_extension="nc",
               mandatory=True,
               help="Select the input netCDF file.",
           ),
           SolrField(
               name="variable",
               mandatory=False,
               facet="variable",
               help=("Select the variables(s) to be plotted"),
               max_items=1,
           )
       )
# Workflow definition of the actual tool
def run_tool(self, setup: dict[str, str]) -> None:
"""This method calls the actual plugin."""
self.call(
f"python src/plot_map.py {setup['in_file']} -v {setup['variable']}"
)UI after Plugin is loaded:
⋊  freva plugin -l
Animator: Animate data on lon/lat grids
ClimateChangeProfile: Create climate change signals.
ClimDexCalc: Calculate the ETCCDI climate extreme indices on the
             basis of daily temperature and precipitation data using
             the ClimDex software provided by PCIC.
Climpact: Process climate model data for input of impact model
CWT: Calculate Circulation Weather Type by mean sea level pressure.
EnsemblePlotter: Create and Plot maps of multi-model ensemble means and
                 standard deviations
MoviePlotter: Plots 2D lon/lat movies in GIF format
Papermill: Parametrize a given notebook
PlottingTool: Plot data⋊ freva plugin plottingtool --doc
PlottingTool (v2022.1.1): Plot data
Options:
in_file (default: <undefined>) [mandatory]
Select the input netCDF file.
variable (default: <undefined>)
Select the variables(s) to be plottedUser Tool Setups/Config are stored in a DB
- Dep. manger: conda-forge
- Freeze environments
- Ensures portability
- Search & Inspect existing results
- Re-apply analyisis
- Share results with others
Client Request
RestAPI
OIDC
MangoDB
Solr
DataLoader
Cache / Broker
Reverse Proxy
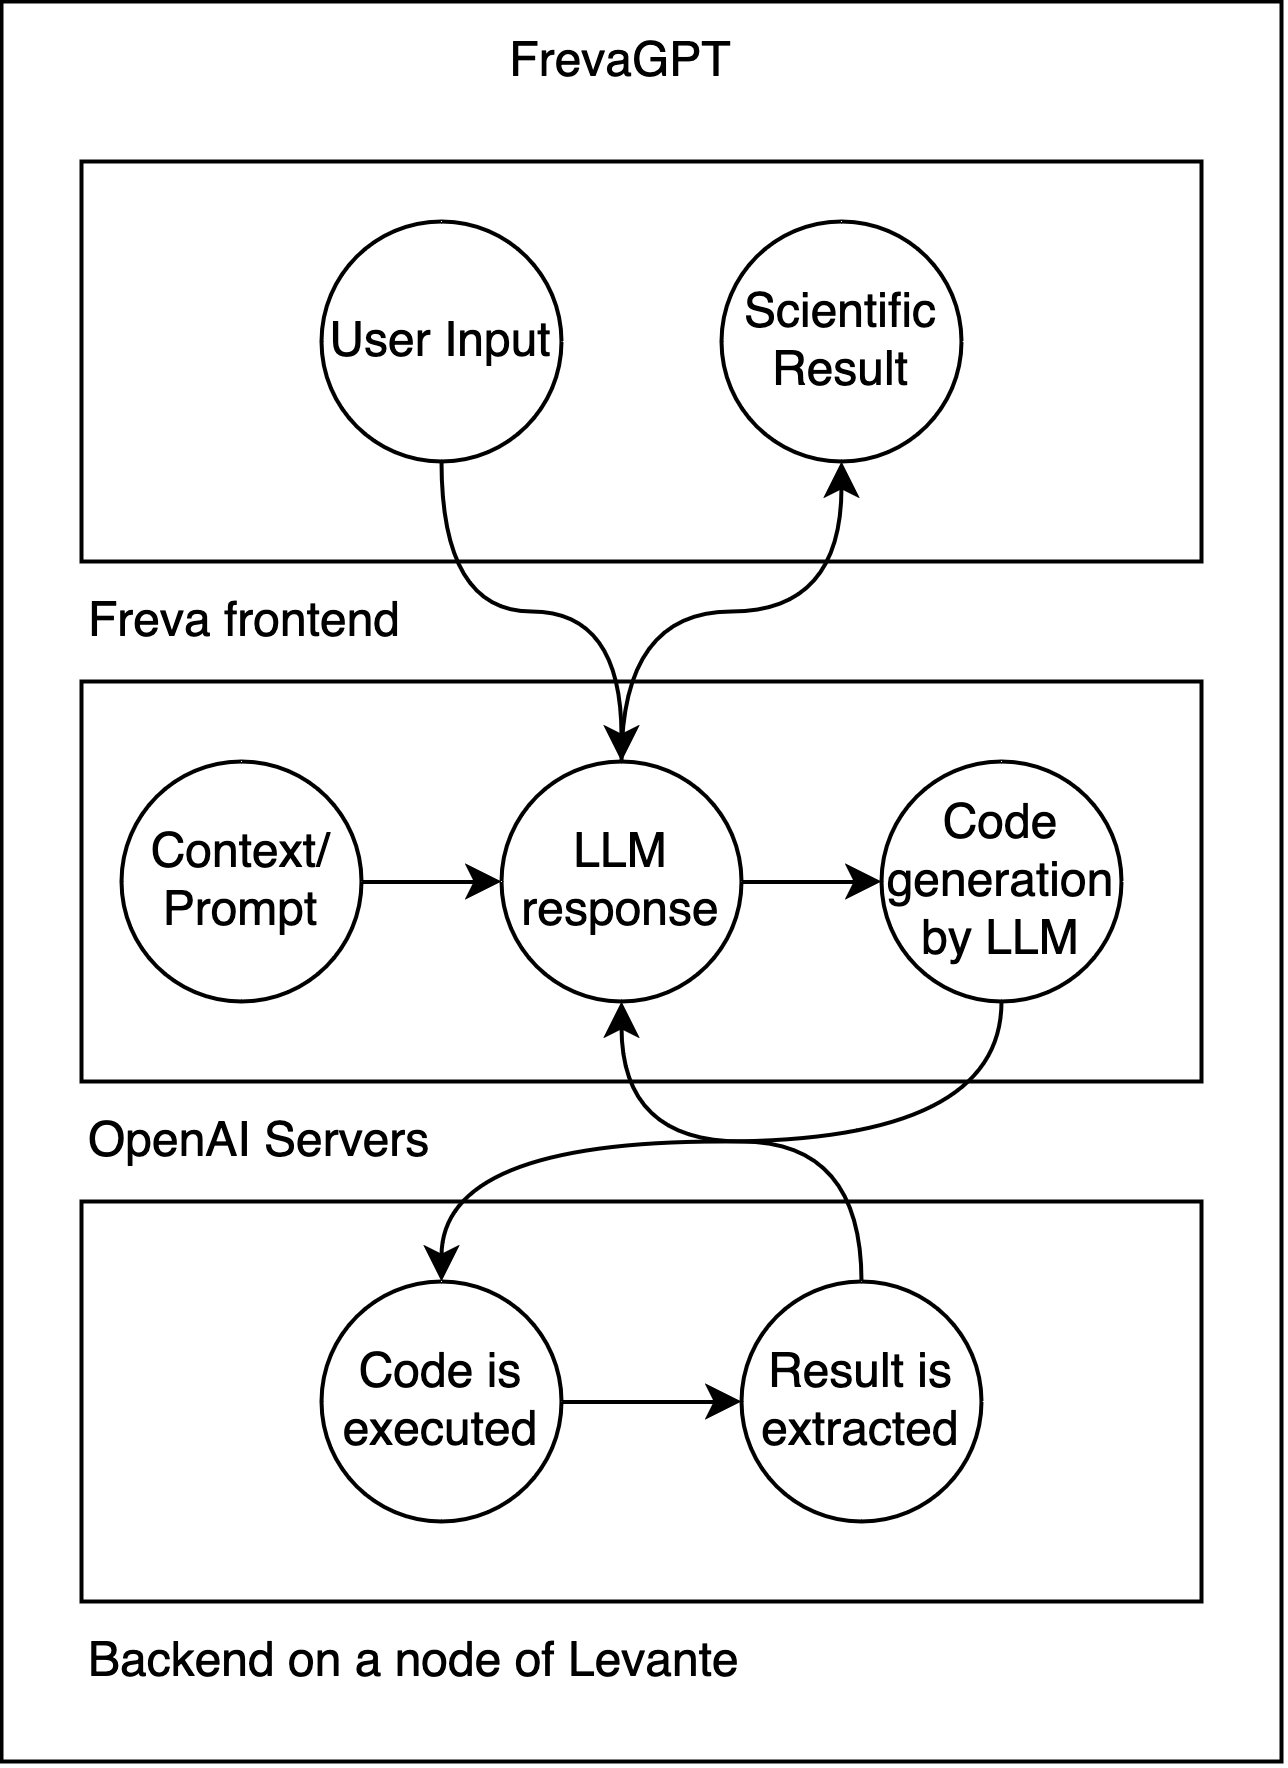
Our take-on of LLMs
A RestFul User Tool Api (WIP)
[metadata]
name = "myplugin"
title = "My Plugin"
version = "0.0.0"
author = "Jane Doe"
contact = "jane@example.com"
short_describtion = "My awesome plugin"
describtion = """This is the story of my
awesome plugin:
Here comes a longer help text.
"""

[[parameter]]
name = "variable_1"
help = "The first variable"
type = "Integer"

[[parameter]]
name = "project"
help = "The data project"
type = "DataBrowser:project"
aggregation = "inputfiles"

[command]
language = "R"
executable = "scripts/process.R"

[output]
type = ["files", "plots"]- Text (TOML) based analysis tool definition.
- Automatic conda env creation and maintenance.
Datasets as Code - Prototype Exists
import freva_client
import xarray as xr
hist_id = 3085 # We can get this ID using the freva.history command
_ = freva_client.register_future_from_history_id(hist_id)
print(freva_client.databrowser(variable="tx90petccdi"))
['future:///scratch/b/b380001/futures/6def5135a687932d27f419a3e993b5bd68aa03425ff0378cfb7745c0aef497a5/cmip5/output1/mpi-m/mpi-esm-lr/historical/yr/atmos/1day/r1i1p1/tx90pETCCDI/tx90pETCCDI_1day_mpi-esm-lr_historical_r1i1p1_199007020000-199207011200']
dset = xr.open_mfdataset(
freva_client.databrowser(variable="tx90petccdi", execute_future=True)
)
print(dset)
🌥 Executing futures ...
<xarray.Dataset>
Dimensions: (time: 3, lon: 192, lat: 96, bnds: 2)
Coordinates:
* time (time) datetime64[ns] 1990-07-02 1991-07-02 1992-07-01T12:00:00
* lon (lon) float64 0.0 1.875 3.75 5.625 ... 352.5 354.4 356.2 358.1
* lat (lat) float64 -88.57 -86.72 -84.86 -83.0 ... 84.86 86.72 88.57
Dimensions without coordinates: bnds
Data variables:
time_bnds (time, bnds) float64 dask.array<chunksize=(3, 2), meta=np.ndarray>
tx90pETCCDI (time, lat, lon) float32 dask.array<chunksize=(3, 96, 192), meta=np.ndarray>
Attributes: (12/13)
CDI: Climate Data Interface version 2.0.5 (https://m...
Conventions: CF-1.4
institution: Max Planck Institute for Meteorology
ETCCDI_institution: UNSW Australia & FUB Berlin
ETCCDI_institution_id: UNSW-CCRC,FUB-IfM
ETCCDI_software: climdex.pcic
... ...
contact: k204230
frequency: yr
creation_date: 2023-09-28T11:10:27Z
title: ETCCDI indices computed on 0
history: Thu Sep 28 13:11:53 2023: cdo -s setlevel,0 cac...
CDO: Climate Data Operators version 2.0.5 (https://m...
xarray.Dataset
Dimensions:
time: 3lon: 192lat: 96bnds: 2
Coordinates:
time
(time)
datetime64[ns]
1990-07-02 ... 1992-07-01T12:00:00
lon
(lon)
float64
0.0 1.875 3.75 ... 356.2 358.1
lat
(lat)
float64
-88.57 -86.72 ... 86.72 88.57
Data variables:
time_bnds
(time, bnds)
float64
dask.array<chunksize=(3, 2), meta=np.ndarray>
tx90pETCCDI
(time, lat, lon)
float32
dask.array<chunksize=(3, 96, 192), meta=np.ndarray>
Indexes: (3)
Attributes: (13)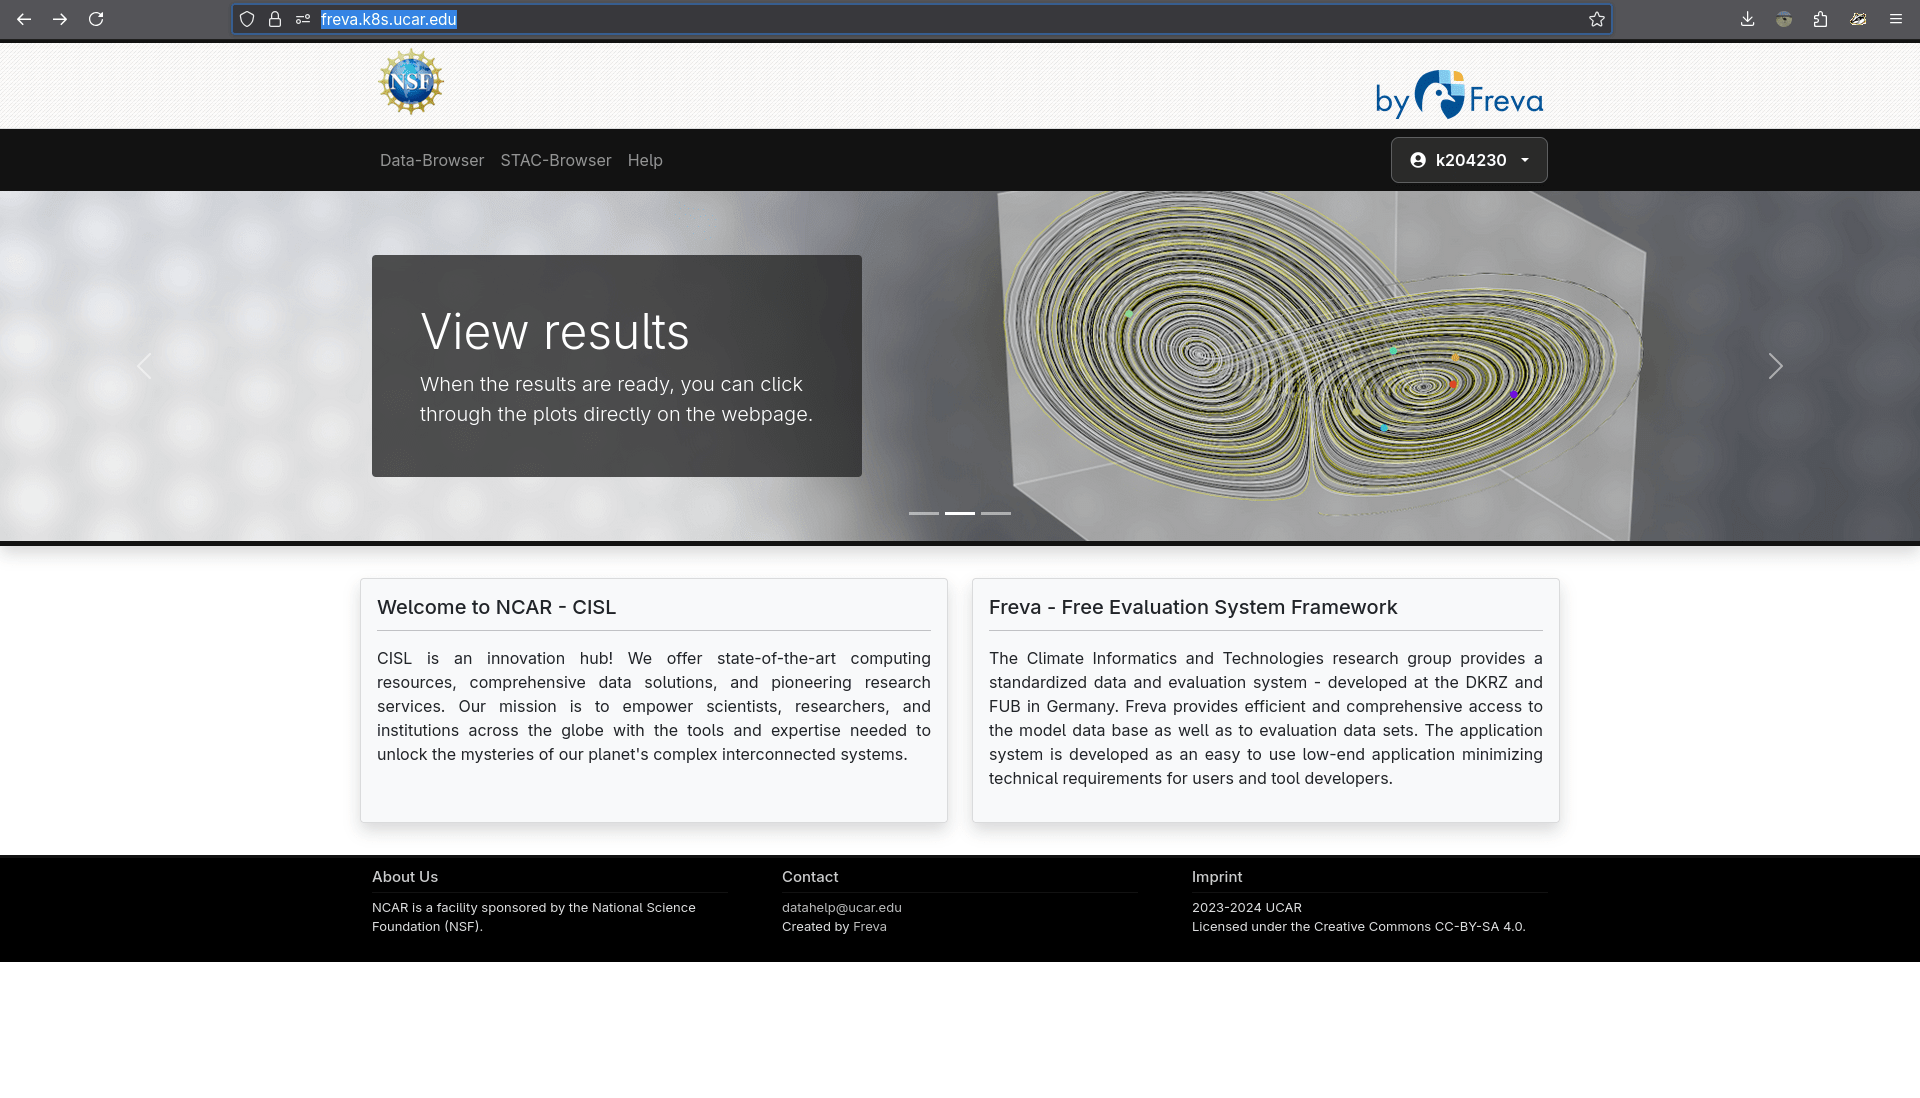
NCAR Prototype: www.freva.k8s.ucar.edu
Thanks!
Also, to this amazing team!